
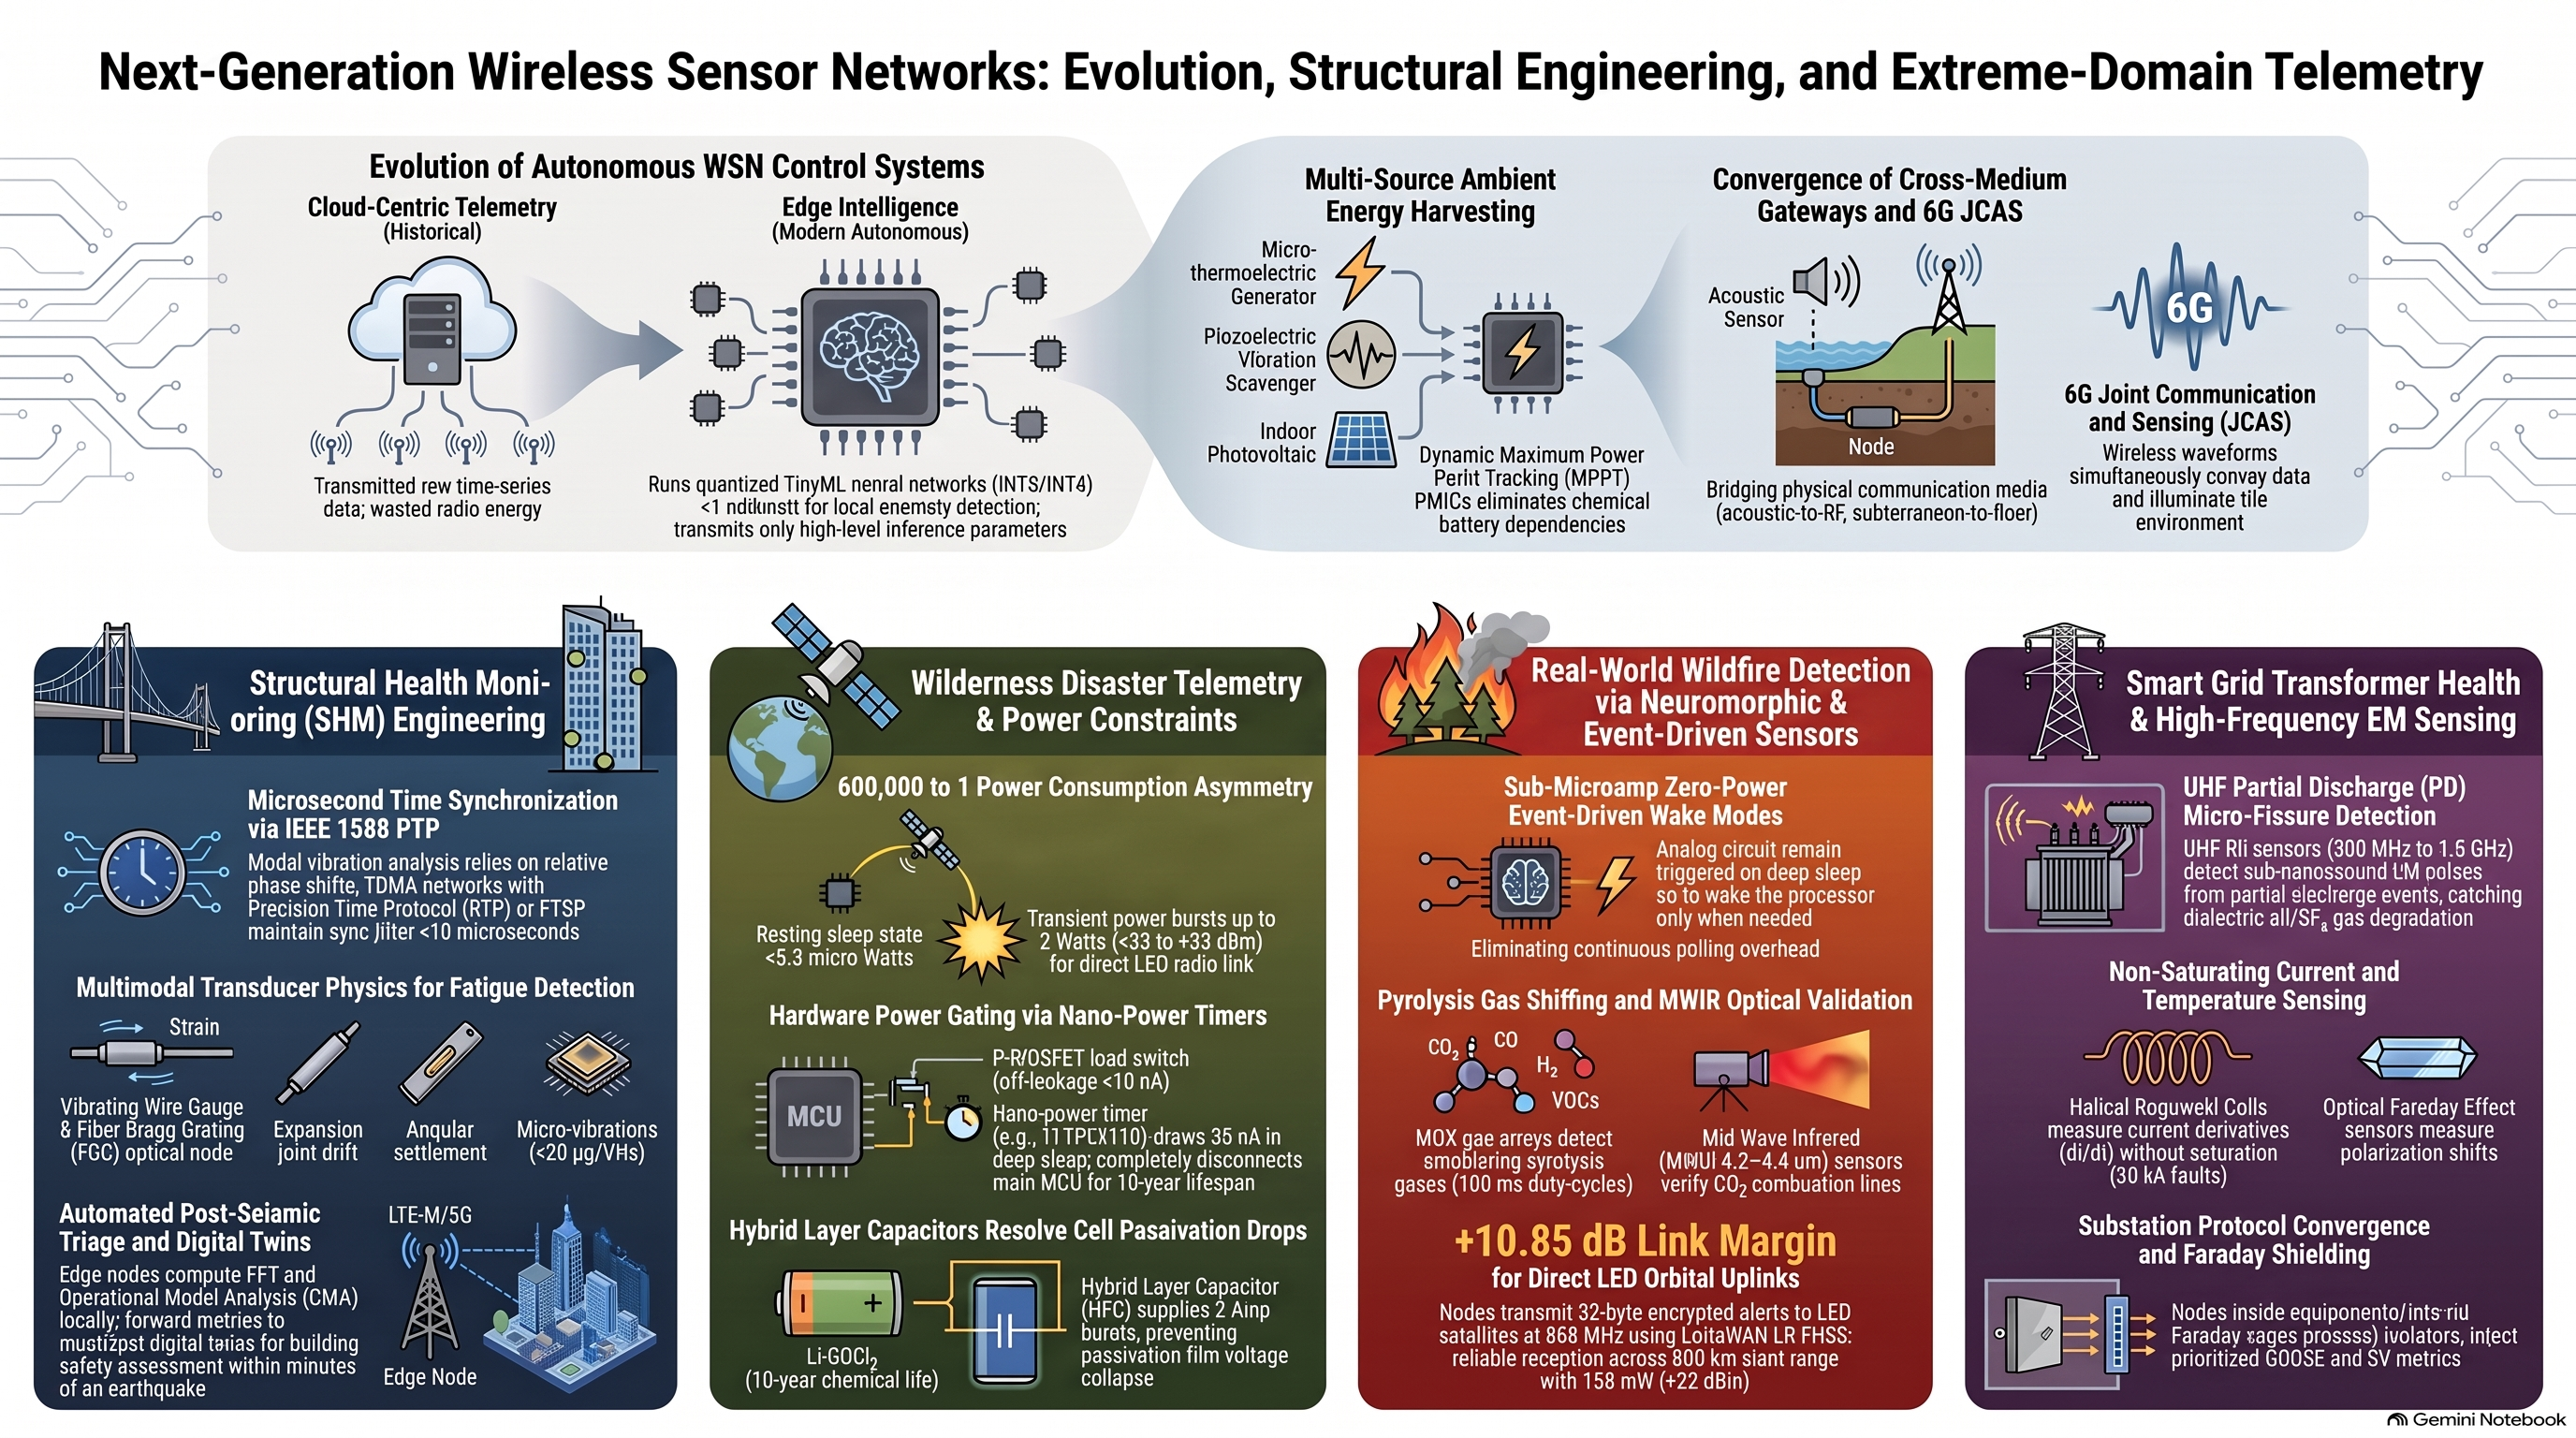
Technical Report: Architectural Frontiers of Autonomous Wireless Sensor Networks in Extreme Physical Domains
- Executive Analysis: Evolution of Autonomous WSN Control System Architectures
The deployment of Wireless Sensor Networks (WSNs) across mission-critical infrastructure and hazardous environments marks a fundamental paradigm shift in distributed computing. Historically, remote sensing relied on passive, centralized telemetry systems that continuously routed raw, unconditioned physical data to cloud servers or off-site data centers. In extreme physical domains, this traditional architecture collapses under severe thermodynamic, bandwidth, and environmental constraints. Processing massive volumes of raw sensor data across lossy, bandwidth-constrained, or non-existent communication channels induces excessive latency and unsustainable transmission energy costs. To ensure operational survivability and continuous real-time decision-making, physical computing must migrate directly to the physical-digital boundary through autonomous, edge-centric WSN architectures.
Technical Transformation Analysis
The evolution from early Radio-Frequency Identification (RFID) and centralized star topologies to modern autonomous sensing fabrics is characterized by key technological breakthroughs across five core functional pillars:
- Edge Compute & TinyML: Machine learning models—specifically quantized neural networks operating with 8-bit or 4-bit integer representations—are executed directly on ultra-low-power microcontrollers (such as ARM Cortex-M33 or RISC-V RV32IMAC cores). By executing in-situ inference at sub-milliwatt (<1\text{ mW}) power profiles, edge nodes compute local spectral transforms, feature extraction, and anomaly classifications. This local compute capability eliminates raw data transmission overhead, reducing RF airtime and energy consumption by orders of magnitude.
- Event-Driven Neuromorphic Sensing: Continuous time-domain polling of physical sensors exhausts finite energy reserves. Modern architectures deploy asynchronous, event-driven analog front-ends and sub-threshold wake-up circuits. These circuits remain in sub-microamp resting states (I_{\text{sleep}} \le 500\text{ nA} – 1.5\ \mu\text{A}), energizing the primary digital compute core only when a physical variable breaches an analog threshold (such as a seismic impulse, gas surge, or dynamic strain delta).
- Multi-Physics Energy Harvesting: Operating without manual maintenance over multi-decade lifespans requires moving beyond standalone primary chemical storage. Autonomous nodes integrate multi-source hybrid energy scavengers that combine piezoceramic vibration harvesters, thermoelectric generators (TEGs) utilizing thermal gradients, and low-lux solar cells. Managed by specialized Power Management Integrated Circuits (PMICs), these harvesters enable continuous battery-less or battery-buffered operation across decades.
- Cross-Medium Gateways: Unifying monitoring data across physically disparate operational domains requires specialized, heterogeneous translation gateways. These nodes bridge isolated physical channels—converting subsea acoustic waves to orbital RF at the ocean surface, converting subterranean Very Low Frequency (VLF) or Extremely Low Frequency (ELF) magnetic induction into fiber-optic backbones at mine portals, and translating Sub-GHz mesh metrics into industrial cloud fabrics.
- Silicon-Level Security: Because edge nodes are deployed in physically accessible or unserviced environments, security is implemented directly in silicon. Microcontrollers integrate hardware Roots of Trust (RoT), Physical Unclonable Functions (PUFs) derived from SRAM or delay characteristics, lightweight cryptographic engines (AES-128/256 CCM, SHA-256), and secure execution environments to enforce zero-trust device authentication and encrypted telemetry without overtaxing limited energy budgets.
Analytical Synthesis: Architecture Comparison
Parameter Legacy Centralized WSN Architectures Autonomous Edge-Centric Sensing Fabrics
Processing Location Centralized Cloud / On-Premise Server In-Situ Transducer / Edge Microcontroller Core
Power Consumption Model High Duty Cycle / Continuous Raw RF Broadcasts Deep-Sleep Micro-Watt / Event-Driven Wake-Up
Network Latency High & Non-Deterministic (Dependent on Backhaul) Deterministic Sub-Millisecond Edge Inference
Bandwidth Efficiency Extremely Low (Transmits Unfiltered Time-Series Data) Ultra-High (Transmits Feature Vectors & Anomaly Alerts)
Failure Domain Isolation Vulnerable to Single-Point Central Gateway Collapses Fully Autonomous Standalone Terminal Immunity
Operational Impact Evaluation
This transformation reshapes the operational risk landscape of critical infrastructure. By transferring data processing and anomaly detection to the node itself, edge-centric fabrics prevent single-point network collapses when backhaul connectivity fails during natural disasters or industrial disruptions. Furthermore, suppressing raw data broadcasts reduces energy consumption, driving down lifecycle maintenance costs by eliminating frequent battery replacement schedules in remote, hostile, or intrinsically hazardous zones.
The engineering principles governing these autonomous edge fabrics find direct application in monitoring civil infrastructure through high-precision Structural Health Monitoring systems.
- Engineering Civil Infrastructure & Structural Health Monitoring (SHM) WSNs
Structural Health Monitoring (SHM) systems form the perceptual foundation for safeguarding critical civil infrastructure—such as suspension bridges, concrete dams, bored tunnels, and high-rise structures—from progressive mechanical fatigue and catastrophic structural failure. By capturing dynamic modal vibrations, microscopic strain variations, and angular displacements caused by wind, traffic, and seismic loading, SHM WSNs enable predictive maintenance and post-event structural triage.
+———————————————————————————–+
| Structural Health Monitoring WSN |
| |
| [ Bridge Deck & Cable Stay Array ] [ Substructure & Abutment Array ] |
| – Ultra-low Noise DC MEMS Accelerometers – Vibrating Wire Piezometers (Pore P) |
| – Fiber Bragg Grating (FBG) Strain Nodes – Dynamic Tiltmeters (Electrolytic) |
| – Linear Variable Differential Transducers- Ultrasonic Crack Opening Sensors |
| │ │ |
| └─────────────────┬────────────────────┘ |
| │ Synchronous TDMA Mesh (Sub-ms Precision PTP) |
| ▼ |
| [ Structural Concentrator / Edge Node ] |
| – Operational Modal Analysis (OMA) Engine |
| – Fast Fourier Transform (FFT) & Peak-Picking |
| │ Fiber Optic Backbone / 5G Industrial Uplink |
| ▼ |
| [ Municipal Infrastructure Management & Digital Twin ] |
| – Post-Seismic Triage & Fatigue Lifecycle Estimation |
+———————————————————————————–+
Transducer Physics & Sensing Modalities
Capturing microscopic structural movements requires high-fidelity transducers operating across dedicated physical mechanics:
- Seismic MEMS Accelerometers: Measure ambient, wind-induced, and traffic-induced dynamic structural responses. Operating with ultra-low noise densities below 20\ \mu\text{g}/\sqrt{\text{Hz}}, these accelerometers capture minute acceleration time-series data required to compute structural mode shapes, natural frequencies, and damping ratios during Operational Modal Analysis (OMA).
- Vibrating Wire Strain Gauges: Measure long-term mechanical strain across structural members. A high-strength steel wire clamped to the structure is plucked by an electromagnetic coil, which reads the wire’s resonant frequency (f). As structural load strains the member, the wire tension shifts according to the mechanical relationship: \Delta \epsilon \propto \Delta f^2 These sensors maintain baseline stability and immunity to electrical noise over multi-decade deployments.
- Fiber Bragg Grating (FBG) Optical Sensors: Etched directly into optical fibers interfaced with wireless interrogators, FBGs reflect a narrow band of light centered at the Bragg wavelength (\lambda_B). Physical deformation of the structural element shifts \lambda_B, yielding precise strain measurements without electrical spark risks.
- Displacement & Settling Modalities: Linear Variable Differential Transformers (LVDTs) measure minute expansions and contractions across expansion joints with sub-millimeter precision. Dual-axis Electrolytic Tiltmeters detect rotational settling and angular displacement within support piers and dam abutments.
Network Architecture & Time Synchronization Protocols
Operational Modal Analysis (OMA) evaluates the spatial mode shapes of civil structures by computing the cross-spectral density matrices and phase alignment between geographically separated sensor nodes. The fundamental relationship between time-synchronization error (\Delta t) and calculated electrical phase error (\Delta \phi) at a given structural mode frequency (f) is expressed as:
\Delta \phi = 2\pi f \Delta t
Standard contention-based CSMA/CA MAC protocols suffer from non-deterministic channel access, back-off variations, and queueing delays, inducing MAC-layer transmission timing jitter on the order of \Delta t \approx 10\text{ ms}. For a fundamental structural mode occurring at f = 100\text{ Hz}, a 10\text{ ms} synchronization jitter yields a catastrophic phase error:
\Delta \phi = 2\pi (100\text{ Hz}) (0.010\text{ s}) = 2\pi\text{ rad} = 360^\circ
A 360^\circ phase uncertainty completely destroys the spatial phase relationship across spatial points, causing mode shape calculations and cross-spectral matrices to collapse.
CSMA/CA (Contention-Based MAC)
Node A: [CCA]–[ Tx Frame ]——–[ Collision / Back-off ]—> (Jitter Δt > 10 ms -> Δφ = 360°)
Node B: ——[CCA]–[ Tx Frame ]—————————–>
TDMA + IEEE 1588 / FTSP (Deterministic Slotting)
Slot 1 (Node A) Slot 2 (Node B) Slot 3 (Node C)
|–[ Sync < 10 µs ]–|–[ Data Burst ]—|–[ Deep Sleep ]—-| (Jitter Δt < 10 µs -> Δφ < 0.36°)
To prevent phase corruption, SHM networks implement Time-Division Multiple Access (TDMA) media access control synchronized via the Precision Time Protocol (PTP / IEEE 1588) or the Flooding Time Synchronization Protocol (FTSP). By maintaining global clock synchronization jitter strictly below \Delta t < 10\ \mu\text{s} across all structural nodes, the maximum bounded phase error at 100\text{ Hz} is constrained to:
\Delta \phi = 2\pi (100\text{ Hz}) (10 \times 10^{-6}\text{ s}) = 0.002\pi\text{ rad} = 0.36^\circ
Bounding phase corruption to <0.36^\circ preserves spatial mode shape fidelity. High-volume vibration time-series data is routed across a short-range 2.4 GHz or 5.8 GHz multi-hop mesh network to structural concentrators. These edge concentrators execute localized Fast Fourier Transforms (FFTs) and peak-picking algorithms before pushing condensed structural metrics over high-throughput 5G or fiber-optic uplinks to central digital twin platforms.
Domain Engineering Challenges & Mitigation
- Environmental Signal Masking: Diurnal ambient temperature cycles induce thermal expansion and contraction in concrete and steel, generating strain and tilt shifts that mask mechanical structural damage. Processing nodes run baseline temperature-normalization algorithms that correlate localized thermal inputs with physical deformations, decoupling environmental noise from genuine structural degradation.
- RF Attenuation in Reinforced Concrete: Radio signals suffer severe path loss when passing through steel-reinforced piers, concrete decks, and metal towers. Engineers mitigate attenuation by strategically positioning directional patch antennas and elevated repeaters to establish clear line-of-sight propagation paths across the structure.
The deterministic synchronization protocols utilized in civil structural dynamics provide a structural foundation for managing high-voltage, high-noise environments found in electrical energy grids.
- High-Frequency Electromagnetic Health Monitoring for Smart Grid Transformers
Real-time health monitoring of high-voltage (HV) utility assets—operating from 115\text{ kV} to 765\text{ kV}—is strategically essential for preventing catastrophic transformer explosions, switchgear destruction, and widespread grid blackouts. Monitoring dielectric degradation, transient current surges, and thermal boundaries allows utilities to implement Dynamic Line Rating (DLR) and predictive asset maintenance.
+———————————————————————————–+
| Smart Utility & Grid WSN |
| |
| [ High-Voltage Overhead Transmission ] [ Distribution Substation / Switchyard] |
| – Dynamic Line Rating (DLR) Thermal Clamps – Rogowski Coil Current Sensors |
| – Surface Acoustic Wave (SAW) Temp Probes – UHF Partial Discharge (PD) Monitors|
| – Optical Faraday Effect Current Sensors – Fiber Optic Bushing Core Monitors |
| │ │ |
| └─────────────────┬────────────────────┘ |
| │ Wi-SUN / IEEE 802.15.4g (Field Area Network) |
| ▼ |
| [ Substation Hardened Edge Gateway ] |
| – IEC 61850 GOOSE / SV Translation Engine |
| – C37.118 Synchrophasor Aggregation Node |
| │ IEC 60870-5-104 / DNP3 over Carrier Fiber |
| ▼ |
| [ Utility Energy Management System (EMS) / SCADA ] |
| – Real-Time Congestion Relief & Automated Fault Isolation |
+———————————————————————————–+
Transducer Physics & Sensing Modalities
Capturing electromagnetic and physical state metrics directly on energized grid assets requires specialized transducer physics:
- Ultra-High Frequency (UHF) RF Sensors (300 MHz–1.5 GHz): Partial discharge (PD) events within dielectric transformer oil or sulfur hexafluoride (\text{SF}_6) gas inside Gas-Insulated Switchgear (GIS) emit short electromagnetic pulses. UHF antennas capture these high-frequency bursts, isolating dielectric insulation micro-fissures long before catastrophic flashover occurs.
- Rogowski Coils: Helical coils wrapped around conductors measure alternating current without utilizing an iron core. They output an analog voltage proportional to the derivative of the primary current: V_{\text{out}} \propto \frac{di}{dt} Because they lack a saturable core, Rogowski coils eliminate the explosive saturation failure modes common to traditional Iron-Core Current Transformers (CTs) under high-magnitude short-circuit fault conditions (>20\text{ kA}).
- Optical Current Transducers (OCTs): Exploit the Faraday Effect, where the polarization angle of a polarized light beam passing through a magneto-optic glass crystal shifts proportionally to the surrounding magnetic field generated by conductor current.
- Dynamic Line Rating (DLR) Assemblies: Line-mounted clamps measure phase conductor state in real time. They integrate dual-axis MEMS inclinometers to monitor conductor sag, infrared arrays to measure conductor core temperature, and ultrasonic anemometers to track local wind cooling.
Electromagnetic Hardening, Shielding, & Parasitic Power Scavenging
Line-mounted nodes operate directly on energized high-voltage conductors utilizing a “bird-on-a-wire” topology. The conductive enclosure forms an equipotential Faraday cage at the line potential (115\text{ kV}–765\text{ kV}), insulating internal electronics from static potential differences.
+—————————————————————————————+
| Multi-Layer Shielding & Isolation Architecture |
| |
| Outer Equipotential Enclosure (Cast Aluminum / Alodine-finished Al-6061) |
| +——————————————————————————-+ |
| | Rounded Corona Ring Geometry (R_edge > 15 mm) | |
| | Waveguide-below-cutoff vents (d < lambda/10) | |
| | | |
| | Inner Magnetic Shield: High-Permeability Mu-Metal (Mu_r >= 50,000) | |
| | +————————————————————————-+ | |
| | | Multi-Layer PCB Ground Plane Architecture | | |
| | | – Galvanic Isolation (CMTI > 150 kV/µs) | | |
| | | – Multi-Stage Transient Clamping: GDT -> Hybrid Choke -> Low-Cap TVS | | |
| | +————————————————————————-+ | |
| +——————————————————————————-+ |
+—————————————————————————————+
Protecting low-voltage microelectronics (1.8\text{ V}–3.3\text{ V}) against harsh utility electrodynamics requires evaluating Shielding Effectiveness (SE_{\text{dB}}), which is defined as the sum of absorption losses (A_{\text{dB}}), reflection losses (R_{\text{dB}}), and internal multi-reflection factors (B_{\text{dB}}):
SE_{\text{dB}} = A_{\text{dB}} + R_{\text{dB}} + B_{\text{dB}}
A_{\text{dB}} \approx 8.686 \cdot \frac{t}{\delta} = 8.686 \cdot t \sqrt{\pi f \mu \sigma}
where t is the shield thickness and \delta is the material skin depth (\delta = 1/\sqrt{\pi f \mu \sigma}). For cast aluminum 6061-T6 (\sigma \approx 3.8 \times 10^7\text{ S/m}, \mu_r = 1), skin depth varies dramatically across the frequency spectrum:
\delta_{60\text{ Hz}} = \frac{1}{\sqrt{\pi (60\text{ Hz}) (4\pi \times 10^{-7}\text{ H/m}) (3.8 \times 10^7\text{ S/m})}} \approx 10.7\text{ mm}
\delta_{100\text{ MHz}} = \frac{1}{\sqrt{\pi (100 \times 10^6\text{ Hz}) (4\pi \times 10^{-7}\text{ H/m}) (3.8 \times 10^7\text{ S/m})}} \approx 8.2\ \mu\text{m}
Consequently, a 3\text{ mm} aluminum enclosure yields t/\delta \approx 365 at 100\text{ MHz}, providing >100\text{ dB} of absorption shielding against high-frequency Very Fast Transients (VFTs) and corona RFI. However, at 60\text{ Hz}, t/\delta \approx 0.28, rendering the aluminum shell virtually transparent to low-frequency powerline magnetic fields. To prevent these 60\text{ Hz} magnetic fields from inducing eddy currents and ADC offset drift in sensitive signal paths, nodes integrate an inner magnetic shield composed of high-permeability Mu-metal (\mu_r \ge 50,000). Enclosure apertures use Waveguide-Below-Cutoff (WBC) geometries (\ell/d \ge 3) to maintain >80\text{ dB} attenuation across high-frequency bands, while internal isolation barriers enforce Common-Mode Transient Immunity (CMTI \ge 150\text{ kV/}\mu\text{s}) to reject steep surge wavefronts. Outer chassis edges feature rounded corona rings (R_{\text{edge}} > 15\text{ mm}) to suppress localized air ionization.
To operate autonomously for 10 to 20 years, nodes scavenge parasitic magnetic energy directly from the conductor via high-permeability nanocrystalline split-core CTs (B_{\text{sat}} \approx 1.2–1.3\text{ T}).
Phase Conductor (I_line = 10 A to 40 kA)
═══════════════════════╦═════════════════════════════════════════════════════
║
+———–╨———–+
| Nanocrystalline Core | (Split-Core Architecture + Air Gap)
| Primary: 1 Turn |
| Secondary: N Turns |
+———–┬———–+
│ Secondary Current (I_s = I_line / N)
▼
+———————–+
| Active MOSFET Shunt | -> Depletion-Mode MOSFET Shunt /
| & Triac Crowbar Array | Bidirectional Thyristor (Fires on Over-Voltage)
+———–┬———–+
│
▼
+———————–+
| Synchronous Active | -> Ultra-low V_drop Ideal Diode Bridge
| Rectifier (H-Bridge) |
+———–┬———–+
│
▼
Regulated 3.3 V Power Rail -> [ Microcontroller / Sensors / Radio ]
Crucially, the split-core assembly incorporates an engineered 0.1–0.5\text{ mm} air gap in the magnetic flux path. This physical air gap serves two functional purposes: it prevents core saturation caused by direct current (DC) bias components (such as geomagnetically induced currents or solar storm transients), and it establishes a soft-saturation knee that limits peak secondary flux during high-current primary surges. When primary line currents spike during a 20\text{ kA}+ symmetrical fault, protection circuits activate: depletion-mode MOSFET arrays short the CT secondary winding across a low-resistance channel, inducing a counter-EMF that forces the core into dynamic short-circuit operation, backed by nanosecond-scale bidirectional Triac crowbars.
Protocol Convergence & Network Integration
Field Area Networks (FANs) deployed across power grids utilize the Wi-SUN standard (IEEE 802.15.4g). Operating in Sub-GHz license-free bands (868\text{ MHz} / 915\text{ MHz}), Wi-SUN uses Frequency-Hopping Spread Spectrum (FHSS) to resist high-frequency ambient RFI and corona noise across distances up to 4\text{ km} per hop. At the substation boundary, edge gateways perform real-time translation, mapping incoming Sub-GHz sensor frames directly into IEC 61850 protocol profiles—specifically Generic Object Oriented Substation Events (GOOSE) and Sampled Values (SV)—enabling direct integration into utility SCADA platforms.
The extreme power gating and energy management techniques perfected for utility monitors are similarly required for remote wilderness disaster telemetry systems.
- Deep-Sleep Power Architectures & Direct-to-Satellite Telemetry in Wilderness Mitigation
Deploying autonomous sensing nodes across remote wilderness environments—for monitoring flash floods, volcanic outgassing, alpine landslides, and forest fires—presents a severe power architecture paradox. Nodes must operate unattended for 5 to 10+ years under dense vegetative canopies that prevent solar harvesting, maintaining micro-watt resting states while periodically generating multi-watt (500\text{ mW} to 5\text{ W}) orbital RF uplinks over slant ranges exceeding hundreds of kilometers.
Micro-Watt Hardware Power Gating
To achieve a 10-year lifespan on a standalone primary battery, the amortized average system current (I_{\text{avg}}) must be constrained:
I_{\text{avg}} = \frac{t_{\text{active}} \cdot I_{\text{active}} + t_{\text{sleep}} \cdot I_{\text{sleep}}}{t_{\text{active}} + t_{\text{sleep}}}
Targeting a baseline sleep draw of I_{\text{sleep}} \le 500\text{ nA} – 1.5\ \mu\text{A} is required. Software-configured microcontroller “deep sleep” modes (0.5–5\ \mu\text{A}) remain vulnerable to code execution freezes or latch-ups caused by cosmic ray events or thermal swings, which can drain a battery within weeks.
+————————————————————————————————-+
| Hierarchical Power-Gated Subsystem Architecture |
| |
| [ Primary Li-SOCl2 Cell ] ──> [ Hybrid Layer Cap (HLC) ] ──> Direct Rail (Unregulated 3.6 V) |
| │ |
| ┌─────────────────────────────────────────────────────────────────┴────────┐ |
| │ │ |
| ▼ (Continuous Low Quiescent Rail, Iq < 50 nA) ▼ |
| +——————————————–+ Active High-Side Load Switches (P-MOSFETs) |
| | Nano-Power System Timer (e.g., TPL5110) | (Off State Leakage < 10 nA) |
| | – Draws 35 nA continuous | ├── Power Rail 1 ──> [ Sensors & AFEs ] |
| | – External Analog Wake Thresholds | ├── Power Rail 2 ──> [ Main MCU Core ] |
| | – Drives EN pins of Main Power Gates | └── Power Rail 3 ──> [ Satellite RF PA / Tx ] |
| +——————————————–+ |
+————————————————————————————————-+
Wilderness nodes implement hard hardware power gating. Integrated load switches with off-state leakage ratings below 10\text{ nA} (e.g., TPS22916) fully isolate the power rails of microcontrollers, sensors, and radios. System timing is driven by an external nano-power timer (such as the TPL5110, drawing \approx 35\text{ nA}), which unpowers the main core entirely and asserts a hardware switch only when a scheduled transmission window opens.
Battery Chemistry, Passivation, & Lifecycle Derivation
Wilderness systems rely on Lithium Thionyl Chloride (\text{Li-SOCl}_2) bobbin cells due to their high gravimetric energy density (>650\text{ Wh/kg}) and wide operational temperature range (-60^\circ\text{C} to +85^\circ\text{C}).
Terminal Voltage
3.6 V ┌──────────────────────────────────────────────┐
│ │
3.0 V ├──────┐ │
│ │ VOLTAGE DELAY DROP │
2.2 V ├──────┼───────────────────────┐ │
│ │ (MCU Brownout Window) │ │
1.8 V ├──────┴───────────────────────┼───────────────┴── Safe Level (Post-Depassivation)
│ │
└──────────────────────────────┴────────────────── Time (ms)
\text{Li-SOCl}2 cells form a protective crystalline Lithium Chloride (\text{LiCl}) passivation film on the lithium anode, restricting self-discharge to <1% per year. However, this passivation film introduces high internal resistance. When a node attempts to draw a 1\text{ A}–2\text{ A} current pulse for a satellite uplink, the internal terminal voltage drops rapidly (V{\text{terminal}} < 2.0\text{ V}), triggering a brownout reset on the microcontroller. To resolve this issue, nodes integrate a Hybrid Layer Capacitor (HLC) in parallel with the bobbin cell. The primary cell trickles microamperes into the HLC, while the HLC’s low Equivalent Series Resistance (\text{ESR} < 100\text{ m}\Omega) supplies the transient 1–2\text{ A} pulse during transmissions, maintaining rail stability above 3.3\text{ V}.
[ Primary Li-SOCl2 Bobbin Cell ] (High Energy Density, Low Continuous Current)
│
├───────────────────────────────────────────────┐
│ Continuous Micro-Current Trickle Charge │
▼ ▼
[ Hybrid Layer Capacitor (HLC) ] [ Low-Leakage System Rail ]
(Low ESR < 100 mΩ, High Pulse Output) │
│ │
└───────────────────────┬───────────────────────┘
▼
[ High-Power Satellite PA ]
To validate this power architecture over a 10-year operational lifecycle, consider a remote flash-flood monitoring node powered by a single 19\text{ Ah} \text{Li-SOCl}_2 D-cell with an integrated HLC:
- Deep-Sleep Mode State (99.96% of time): Continuous resting current includes the nano-power timer (35\text{ nA}), an active sub-threshold comparator (300\text{ nA}), load switch leakage (10\text{ nA}), and an ultra-low I_q buck regulator (60\text{ nA}), yielding I_{\text{sleep}} = 405\text{ nA} \approx 0.41\ \mu\text{A}. Over 10 years: \text{Capacity}_{\text{sleep}} = 0.41\ \mu\text{A} \times 24\text{ h/day} \times 365\text{ days/yr} \times 10\text{ yrs} = 35.9\text{ mAh}
- Sensor Interrogation State (Hourly Routine): The MCU boots, powers sensors for t_{\text{sense}} = 0.5\text{ s} at I_{\text{sense}} = 18\text{ mA}, logs metrics, and unpowers. Daily energy consumed: E_{\text{sample}} = 0.5\text{ s} \times 18\text{ mA} = 0.0025\text{ mAh/sample} \implies 24 \times 0.0025 = 0.060\text{ mAh/day} \text{Capacity}_{\text{sense}} = 0.060\text{ mAh/day} \times 365\text{ days/yr} \times 10\text{ yrs} = 219.0\text{ mAh}
- Orbital Satellite Uplink State (Twice Daily): The node fires a 10\text{ s} LR-FHSS burst at I_{\text{tx}} = 130\text{ mA} (+22\text{ dBm}). Daily energy consumed: E_{\text{tx}} = 10\text{ s} \times 130\text{ mA} = 0.361\text{ mAh/burst} \implies 2 \times 0.361 = 0.722\text{ mAh/day} \text{Capacity}_{\text{tx}} = 0.722\text{ mAh/day} \times 365\text{ days/yr} \times 10\text{ yrs} = 2,635.3\text{ mAh}
Summing these operational phases yields a cumulative 10-year operational drain of:
\text{Capacity}_{\text{operational}} = 35.9\text{ mAh} + 219.0\text{ mAh} + 2,635.3\text{ mAh} = 2,890.2\text{ mAh} \approx 2.89\text{ Ah}
Accounting for a 10% compound chemical self-discharge derating over a decade (1.90\text{ Ah}), the total consumed capacity is 4.79\text{ Ah}. Compared against the cell’s 19.0\text{ Ah} nominal rating, total chemical capacity utilization is:
\text{Capacity}_{\text{utilized}} = \frac{4.79\text{ Ah}}{19.0\text{ Ah}} \times 100% = 25.2%
This leaves a 74.8% remaining safety margin, proving that micro-watt power gating renders multi-decade autonomous operation mathematically viable.
Direct-to-Satellite IoT Link Budget Engineering
Closing an RF link between a battery-powered sensor on the ground and a Low-Earth Orbit (LEO) satellite at an 800\text{ km} slant range is evaluated using the Friis Transmission Equation:
\text{FSPL}{\text{dB}} = 20\log{10}(d) + 20\log_{10}(f) + 20\log_{10}\left(\frac{4\pi}{c}\right)
For an 868\text{ MHz} uplink over an 800\text{ km} slant range (8 \times 10^5\text{ m}), Free Space Path Loss (\text{FSPL}) is calculated as:
\text{FSPL}{\text{dB}} = 20\log{10}(8 \times 10^5) + 20\log_{10}(868 \times 10^6) – 147.55 = 118.06 + 178.77 – 147.55 = 149.28\text{ dB}
Link Parameter Quantitative Value Parameter Engineering Context
Transmit Power Output (P_{\text{tx}}) +22.00\text{ dBm} 158\text{ mW} RF Power from Low-Power Silicon
Transmit Antenna Gain (G_{\text{tx}}) +2.15\text{ dBi} Omnidirectional Sub-GHz Half-Wave Dipole Antenna
Free Space Path Loss (\text{FSPL}) -149.30\text{ dB} 800\text{ km} Slant Range at 868\text{ MHz} Frequency
Atmospheric & Rain Attenuation (L_{\text{atm}}) -0.50\text{ dB} Minimal Clear-Air Loss below 1\text{ GHz}
Polarization Mismatch (L_{\text{pol}}) -3.00\text{ dB} Linear Ground Dipole to RHCP Orbital Antenna
Ionospheric Scintillation Margin (L_{\text{margin}}) -3.00\text{ dB} Solar Activity and Fading Margin Protection
Satellite Receive Antenna Gain (G_{\text{rx}}) +6.00\text{ dBi} Phased Array Receiver Gain on Satellite Host
Total Received Signal Power (P_{\text{rx}}) -125.65\text{ dBm} Power Level Input to Satellite LNA
Thermal Noise Floor (N) -134.00\text{ dBm} 125\text{ kHz} Channel Bandwidth Noise at Room Temp
Satellite Receiver Sensitivity Limit -137.00\text{ dBm} Sensitivity Threshold for LoRa/LR-FHSS Waveforms
Final Computed Link Margin +11.35\text{ dB} Positive Link Margin (>+10\text{ dB} Goal Met)
To counter Doppler shifts (\pm 35–40\text{ kHz}) and receiver saturation, satellites utilize modulation schemes like LoRaWAN LR-FHSS (Long Range Frequency Hopping Spread Spectrum). LR-FHSS splits payloads into small fragments and hops pseudorandomly across 488\text{ Hz} wide sub-channels. Alternatively, 3GPP Release 17 IoT-NTN (Non-Terrestrial Networks) pre-compensates for Doppler offsets and propagation delays inside the baseband processor prior to transmission.
These wilderness power management and long-range uplink techniques are applied directly in event-driven early wildfire detection networks.
- Case Study: Early Wildfire Detection via Event-Driven Neuromorphic Sensing
Early-stage wildfire ignition detection represents an operational scenario where traditional optical and satellite imaging systems underperform. Deep forest canopy boundaries obscure visual smoke plumes and thermal reflections during early smoldering phases. Resolving this challenge requires deploying in-situ sensing networks capable of localized event-driven chemical classification.
+—————————————————————————————————-+
| Autonomous Wilderness Early-Warning Node |
| |
| [ PRIMARY POWER SUPPLY ] |
| Li-SOCl2 Cell (3.6 V) ──┬──> [ Hybrid Layer Capacitor (HLC) ] ──> Main Switched Rail |
| │ |
| └──> [ Ultra-Low Iq Step-Down Buck ] (Quiescent Current = 60 nA @ 2.5 V) |
| │ |
| ▼ (Regulated 2.5 V Always-On Rail) |
| [ WAKE CONTROL & ASYNCHRONOUS LOGIC ] |
| ├── Nano-Timer (TPL5110) [35 nA] ──────────────────────────────────────────┐ |
| └── Dual-Axis Nano-Comparator (TLV7031) [300 nA] ──(Trip Threshold) ──────┤ |
| │ |
| ▼ |
| [ LOAD GATING SWITCHES ] <────────────────────────────────────── Assert System Power |
| TPS22916 Load Switches (Off-state leakage = 10 nA) |
| ├── System Power Switch A ──> Microcontroller Core (ARM Cortex-M33 @ 24 MHz) |
| ├── System Power Switch B ──> Disaster Sensor Array Front-End |
| └── System Power Switch C ──> Satellite Transceiver + Front-End RF Module |
| |
| [ SENSOR MEASUREMENT FRONT-END ] |
| – Micro-Electrochemical Gas Cell (Zero-Bias CO/H2 Amplifier, 1.2 µA) |
| – Mid-Wave Infrared (MWIR) Photodetector Array (4.2–4.4 µm CO2 Signature) |
| |
| [ SATELLITE RF ENGINE ] |
| – SX1262 / LR1121 Transceiver (Direct LEO LR-FHSS Satellite Mode) |
| – High-Efficiency Power Amplifier (+22 dBm Output) |
+—————————————————————————————————-+
Pyrolysis Gas Chemistry & Sensing Physics
During smoldering combustion, biomass undergoes thermal pyrolysis, releasing signature gas profiles prior to open flaming:
- Metal Oxide Semiconductor (MOX) Multi-Gas Arrays: MOX sensors monitor rapid shifts in Hydrogen (\text{H}_2), Carbon Monoxide (\text{CO}), and Volatile Organic Compounds (\text{VOCs}). These chemical shifts allow nodes to identify smoldering organic material hours before heat profiles become visible to satellite radiometers.
- Mid-Wave Infrared (MWIR) Photodetectors: MWIR arrays target the specific 4.2–4.4\ \mu\text{m} spectral emission band corresponding to hot carbon dioxide (\text{CO}_2) generated by biomass combustion, filtering out ambient solar reflections.
Asynchronous Neuromorphic Power Management Circuitry
Standard MOX sensors require continuous heating element power (>50\text{ mW} at 200^\circ\text{C}–300^\circ\text{C}), which drains standalone primary batteries within days. To reduce power draw, nodes implement pulsed-thermal duty cycling: the heating element is energized for 100\text{ ms} once every 10 minutes, reducing continuous power consumption by 99.9%.
Sensor Transducer (Unheated Electrochemical Cell, 1.2 µA)
│
▼
[ Nano-Power Op-Amp ] (LPV802, Iq = 320 nA)
│
▼
[ Sub-Threshold Voltage Comparator ] (TLV7031, Iq = 300 nA) ──[ Reference V_ref ]
│
▼ (Edge Interrupt Output)
[ EN Pin of Load Switch ] (TPS22916, Off Leakage < 10 nA) ──> Closes Gate ──> MCU Boots (< 5 ms)
To maintain continuous vigilance between thermal pulses without draining the battery, the always-on wake control rail is powered by an ultra-low I_q step-down buck converter drawing a quiescent current of 60\text{ nA} at 2.5\text{ V}. Unheated electrochemical cells (\text{CO}, \text{H}_2) operate within zero-bias potentiostatic circuits drawing 1.2\ \mu\text{A}, feeding a nano-power operational amplifier (LPV802, I_q = 320\text{ nA}) and a sub-threshold comparator (TLV7031, I_q = 300\text{ nA}). The entire asynchronous front-end draws under 2\ \mu\text{A} total standby current (60\text{ nA} + 1200\text{ nA} + 320\text{ nA} + 300\text{ nA} = 1.88\ \mu\text{A}).
This front-end directly interfaces with the hardware power-gating architecture detailed in Section 4: when pyrolysis gas levels breach the reference threshold, the TLV7031 comparator output trips, pulling the active-high enable pin of the TPS22916 load switch high. This applies power to the primary ARM Cortex-M33 microcontroller rail within 5\text{ ms}.
Operational Execution & Anomaly Classification
The end-to-end operational execution follows a deterministic, event-driven sequence:
Physical Pyrolysis Gas Threshold Breach
│
▼
Analog Sub-Threshold Comparator Interrupt (TLV7031, Iq = 300 nA)
│
▼
Hardware Load Switch (TPS22916) Closes ──> MCU Boots within 5 ms
│
▼
TinyML Spectral Verification (Quantized Neural Net validates gas signature)
│
▼
Direct LEO Satellite LR-FHSS Burst Dispatch (+22 dBm uplink)
- Physical Breach: Smoldering pyrolysis gases reach the zero-bias electrochemical cell, inducing a voltage shift.
- Hardware Interrupt: The TLV7031 comparator detects the threshold breach and drives the EN pin of the TPS22916 load switch high, powering the primary system rail.
- Fast MCU Boot: The main microcontroller core (ARM Cortex-M33) initializes from an unpowered state within 5\text{ ms}.
- TinyML Spectral Confirmation: The core executes an onboard quantized neural network model to evaluate incoming gas and MWIR spectral profiles, validating the ignition event and rejecting false positives (such as ambient humidity spikes or animal presence).
- Satellite Dispatch: Upon high-confidence classification, the system powers the satellite RF front-end, transmitting an encrypted LR-FHSS burst to an overhead LEO constellation.
This event-driven execution pipeline illustrates the specialized trade-offs required across different operating environments.
- Strategic Comparative Synthesis & System Decision Framework
Successfully deploying Wireless Sensor Networks across extreme operating domains depends on aligning system hardware, network protocols, and power management architectures directly with the governing physical constraints of the deployment environment.
Cross-Domain Technical Matrix
Engineering Parameter Civil Infrastructure (SHM) Smart Grid & Power Utilities Wilderness Disaster Mitigation Early Wildfire (Case Study Focus)
Primary Physical Medium Steel/Concrete Structures High-Voltage E/M Fields Deep Canopy / Remote Land Forest Air / Canopy Boundary
Transmission Frequency / PHY 2.4/5.8 GHz, Sub-GHz Mesh Sub-GHz Wi-SUN (FHSS) Sub-GHz / L-Band Satellite Sub-GHz LR-FHSS to Satellite
Clock Synchronization Requirement Sub-millisecond (<10\ \mu\text{s}) Microsecond (<1\ \mu\text{s}) Asynchronous / Low Asynchronous / Event-Triggered
Dominant Energy Model Ambient Vibration / Solar Parasitic Induction (CT) / E-Field Primary \text{Li-SOCl}_2 + HLC Buffer Pulsed-Thermal Primary Cell
Primary Physical Failure Mode Multi-path / Signal Masking Extreme EMI, VFT Surge, Corona Passivation Collapse, Cold Temp Biofouling, Thermal Erosion
Typical Target Lifespan 10–30 Years 15–20 Years 5–10+ Years 5–10 Years
(Note: Physical failure modes in utility environments incorporate the high-voltage EMI hardening, VFT surge protection, and corona suppression principles established in Section 3).
Architectural Decision Framework
Systems architects designing embedded WSNs for deployment in physical boundary domains should follow a four-step derivation process:
+———————————————————————————–+
| System Architecture Decision Flow |
| |
| 1. Physical Channel Characterization |
| – Measure path loss, EMI spectrum, dielectric constants, & Doppler spread |
| – Select carrier frequency (Sub-GHz, Microwave, Satellite, or Acoustic) |
| |
| 2. Energy Budget & Storage Derivation |
| – Derive max system current: I_avg = (t_activeI_active + t_sleepI_sleep)/T |
| – Select primary chemistry (e.g., Li-SOCl2 + HLC) or parasitic harvester |
| |
| 3. Timing, Determinism, & MAC Selection |
| – Map synchronization bounds (Sub-ms OMA -> TDMA/PTP; Event -> Asynchronous) |
| |
| 4. Hardware Edge Intelligence Integration |
| – Integrate sub-threshold analog comparators & TinyML inference models |
| – Maximize local compute to minimize high-power RF airtime |
+———————————————————————————–+
- Physical Channel Characterization: Quantify the electrodynamic properties of the physical medium—including attenuation constants (\alpha), dielectric permittivity (\epsilon_r), electromagnetic interference (EMI) profiles, multipath delay spreads, and Doppler frequency shifts. Use these parameters to establish the carrier frequency and PHY layer (e.g., Sub-GHz mesh, satellite uplink, or acoustic link).
- Energy Budget & Storage Derivation: Calculate the maximum allowable average current (I_{\text{avg}}) based on the target operational lifespan and available energy reserves. Evaluate primary chemical storage requirements (such as \text{Li-SOCl}_2 paired with Hybrid Layer Capacitors to prevent passivation voltage drop) or select parasitic energy harvesting mechanisms (such as split-core current transformers or thermoelectric generators).
- Timing & Determinism Selection: Match application synchronization requirements to medium access control protocols. Where phase-aligned structural modal analysis is required, enforce time-deterministic MAC frameworks (such as TDMA paired with IEEE 1588 PTP or FTSP). Where isolated anomaly detection is required, deploy asynchronous event-driven trigger architectures.
- Hardware Edge Intelligence Integration: Implement sub-threshold analog detection logic and quantized TinyML inference engines at the front-end pipeline. By shifting signal classification directly to the microcontroller core, the system minimizes raw data broadcasts, reducing RF power consumption and ensuring multi-year autonomous operation in extreme physical domains.